
Case Study: IBM Watson wins Jeopardy
In 2011, an AI system beat two humans at one of the most challenging mental tasks, the game of Jeopardy. To win this game, you need to know massive amounts of cultural, scientific, and historic information. AND you have to be able to relate the data to clues in humor and metaphor. Developed by IBM and named Watson in honor of the founder of IBM, the AI system read 200,000 Wikipedia pages as one of the ways it “learned” the background information it needed. Watch the 3-min video of the show’s highlights. Pay attention to the nature of the questions that the AI system had to FIGURE OUT!
Graphical Information: an introduction
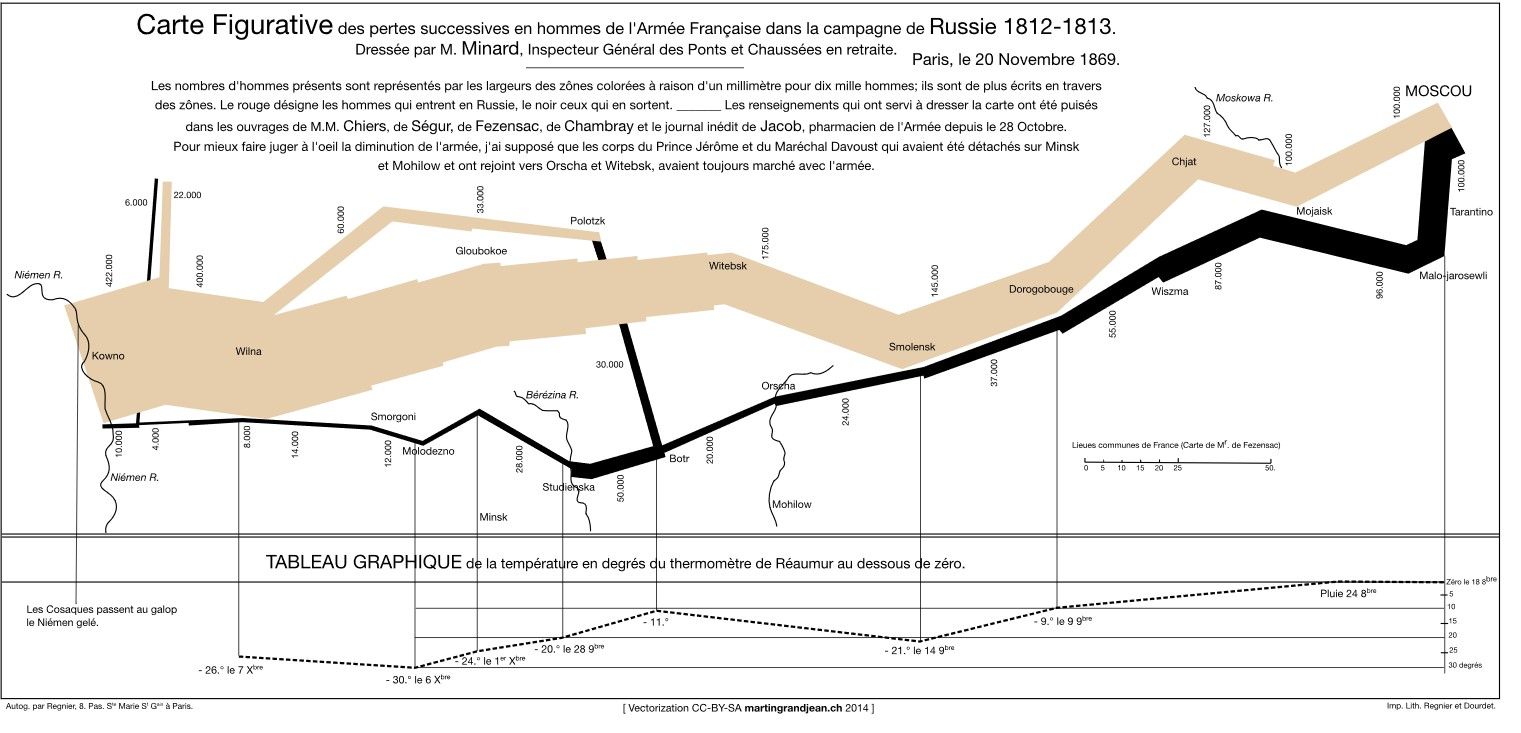
The Guru of Graphical Information is Edward Tufte. Here are excepts from one of his talks to help you understand the role of graphical information. This is excellent background to help understand the role of graphics and graphs in exploring and communicating data. The short video is below (link below video). Tufte popularized a graphical map that has been called the most powerful graphical example of communication. Make Minard’s Map of Napolean’s March on Moscow as large as you can, and STUDY it to see how Napoleon began his invasion of Russia with an army of 400,000 which steadily shrank, partly due to the Moscow winter. He returned to Paris with only 10,000 survivors!
Minard’s Map of Napolean’s March on Moscow (click link to view): https://public-media.interaction-design.org/images/uploads/b68bf43d3c90947460555228d8858beb.jpg
Graphing & Map Example in R (London Underground Map): Just browse through the whole web page, noting especially how a Google map of London was added at the end of the project: https://towardsdatascience.com/the-5-minute-learn-create-pretty-and-geographically-accurate-transport-maps-in-r-63f2cb77c227
Sampling in AI and ML (and essential terminology)
In traditional statistics, a researcher is interested in the behavior of a large group, perhaps the rate of cognitive decline in males over the age of 65. The total group of interest is all of those males, millions of them, and they are called the “population” of interest. But traditional methods either couldn’t collect data on the whole population or couldn’t mathematically analyze it. The accepted solution is to take a “sample” of the data, just some of those males in the hope that perhaps a few hundred or thousand will “represent” the population. To eliminate bias, the subjects in a research study are “randomly selected” to gain the useful “representative sample.” Now that large data sets and fast calculating are more accessible, the process has changed to be much more representative of the population: rather than one random sample, hundreds or thousands of random samples are taken. Those samples become a “sampling distribution” that is used in modern statistics.
The process of repeated sampling and the use of “sampling distributions” is an important topic in Bayesian modeling and in artificial intelligence in general. It’s difficult to explain; it’s much better to experience it. Here’s a very basic introduction. Be sure to try out the applet, following the direction of the narrator: https://www.youtube.com/watch?v=BwE2a18Th4c
Here’s the applet: https://onlinestatbook.com/stat_sim/sampling_dist/index.html